
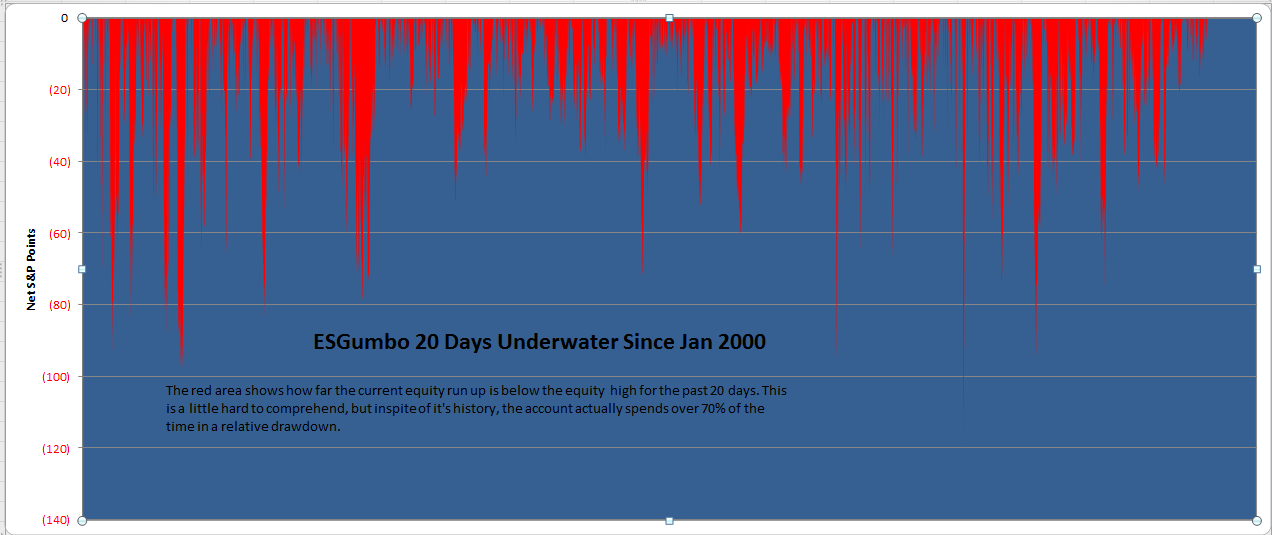
The above chart shows the 20 day underwater incidence for the ESGumbo portfolio. This is calculated by taking the current equity curve value and subtracting the equity curve high for the past 20 trading days (approx. 1 month). When you look at the system this way, it shows that it is in some kind of drawdown over 70% of the time. This of course is not what we want, but it is unavoidable. This speaks to the psychology of trading and the amount of anxiety that must be endured for the satisfaction which occurs when the system is making new highs. Inevitably, the former is going to outweigh the latter. Click on the chart to enlarge the image.
No comments:
Post a Comment